Prometheus & Grafana Setup
Atavism 10.6.0+
This document described how to set up Prometheus and Grafana to monitor your Atavism Server.
- Grafana Setup
a) Create an account on https://grafana.com/
b) Create Grafana Stack and name it as you want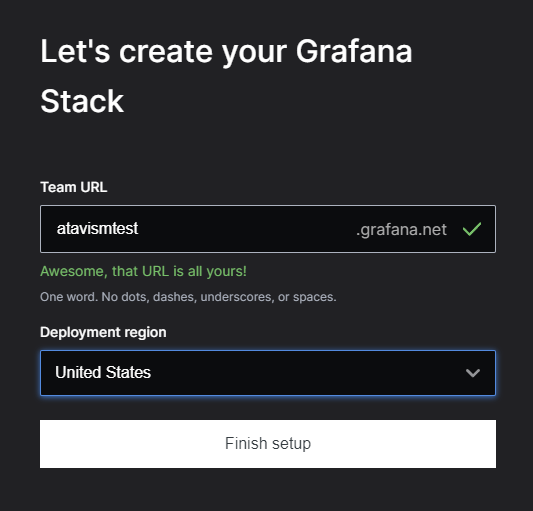
c) Skip the rest of the configuration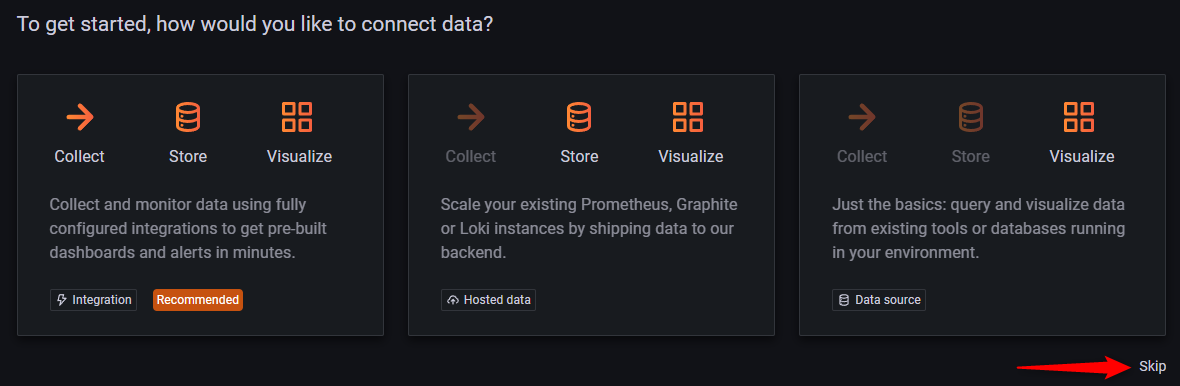
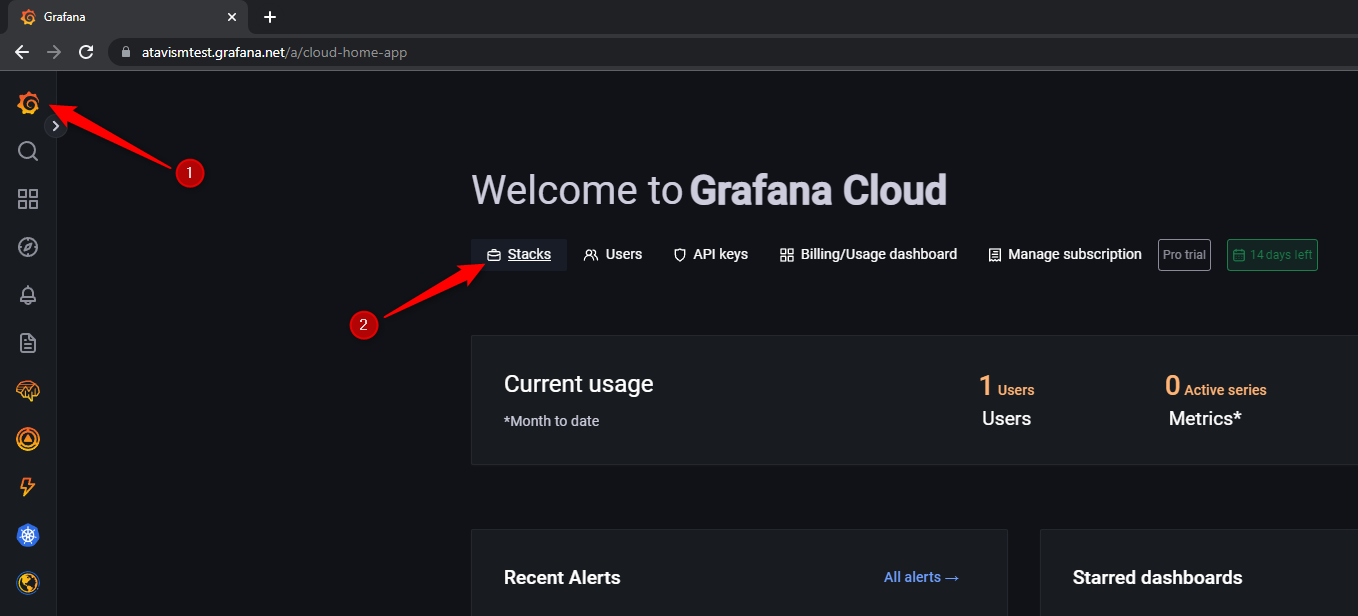
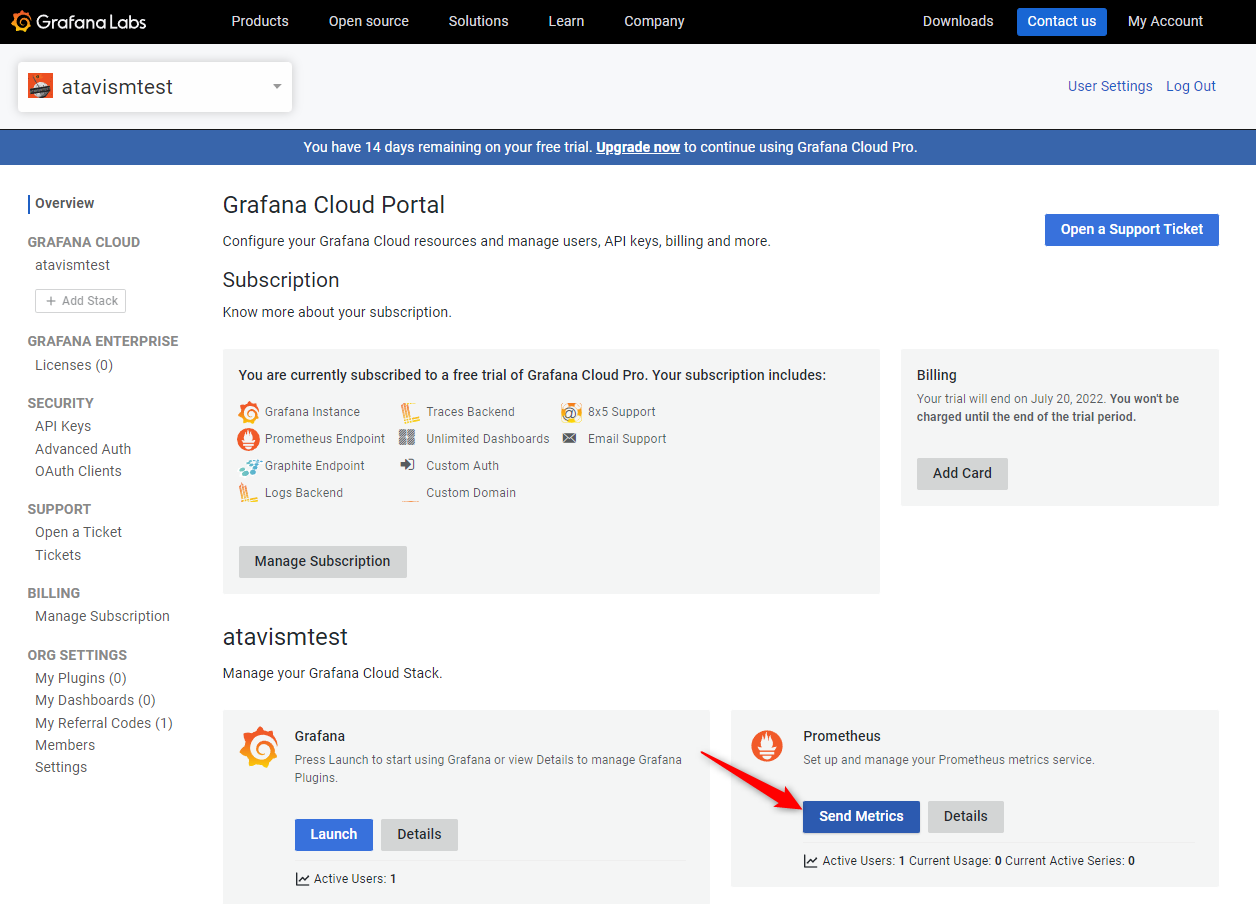
d) Click on the Grafana logo and then select the Stacks option
e) Click Send Metrics within the Prometheus block
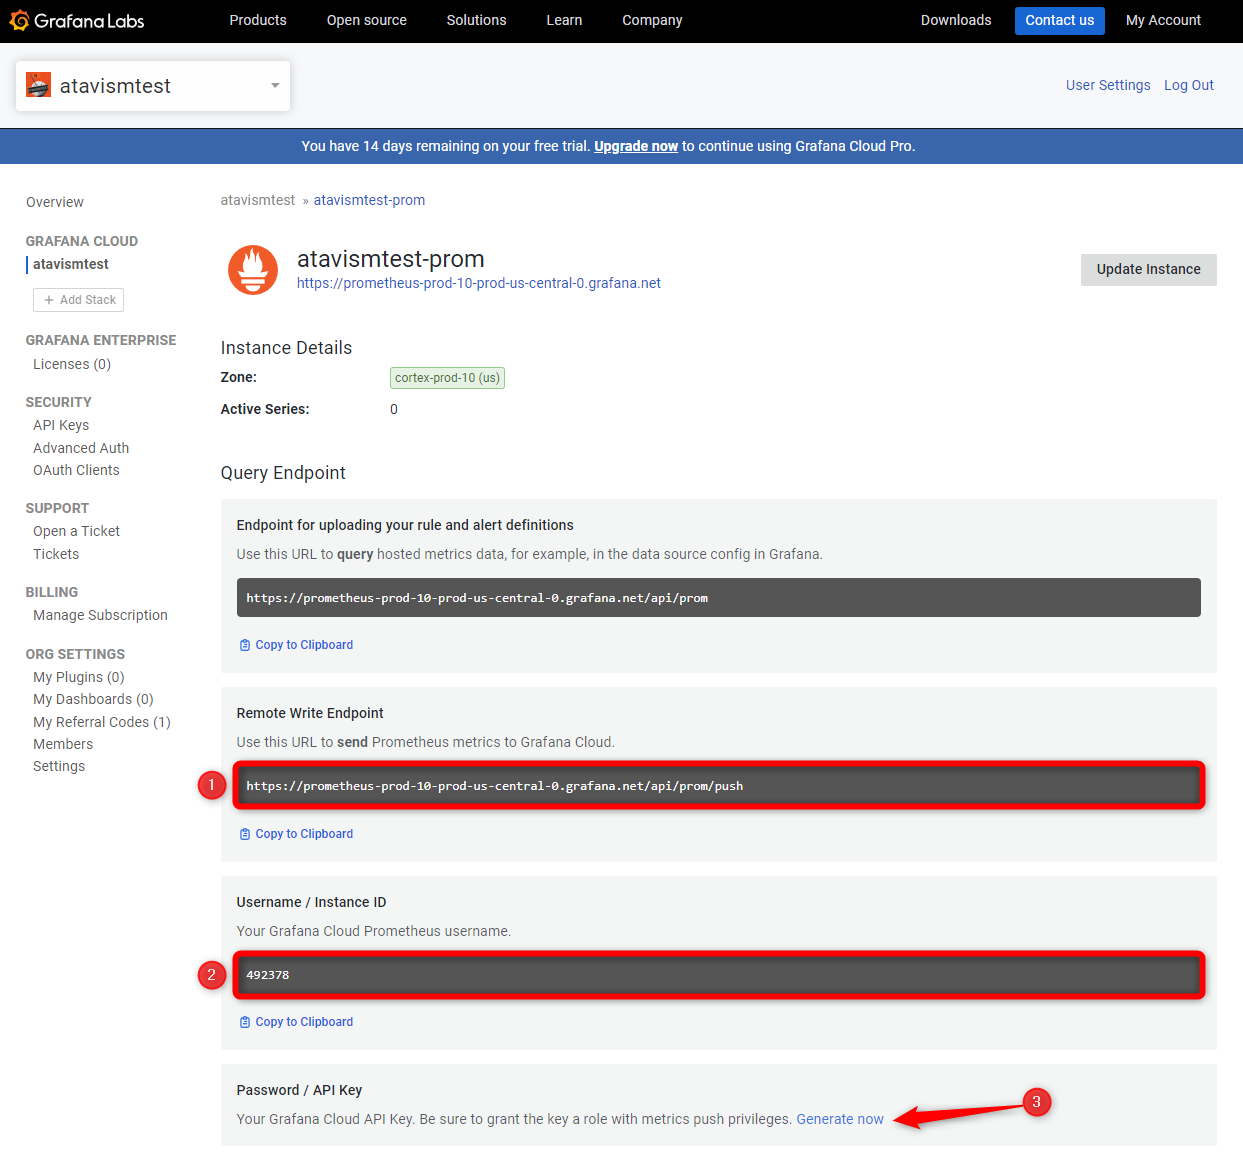
f) Copy Remote Write Endpoint URL and Username / Instance ID somewhere in the text file as we will need it further and click Generate now in the Password / API Key section as on the screenshot below
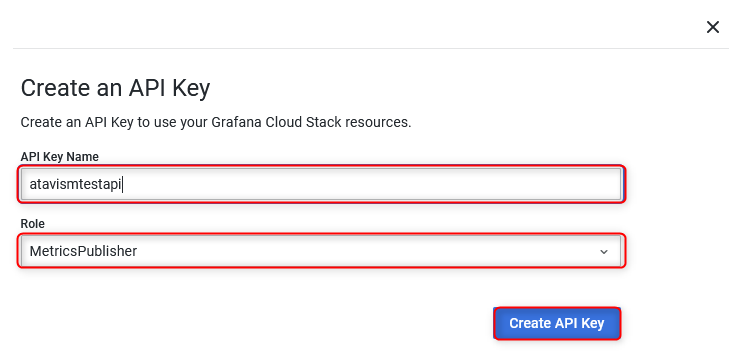
g) Set API Key Name whatever you want and select Role as MetricsPublisher and click Create API Key
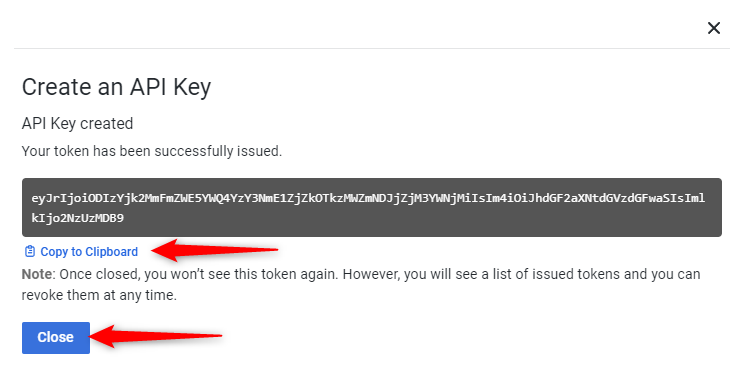
h) Click Copy to Clipboard and save it somewhere in your text document along with Username and URL and then click the Close button
- Install Prometheus on the Atavism Server using an SSH connection
a) Create usersudo useradd --no-create-home --shell /bin/false prometheusb) Create directories
sudo mkdir /etc/prometheus
sudo mkdir /var/lib/prometheus
c) Set owner for newly created directories
sudo chown prometheus:prometheus /etc/prometheus
sudo chown prometheus:prometheus /var/lib/prometheus
d) Download Prometheus from the official project website https://prometheus.io/download/
Important Note: Download the proper version for your system architecture
e) Unpack the packagetar xvf prometheus-2.36.2.linux-386.tar.gzImportant Note: Replace the file name with your Prometheus version
f) Rename the directory to follow the rest of the installation process easilymv prometheus-2.36.2.linux-386 prometheuspackageg) Copy files and set prometheus user as the owner for them
sudo cp prometheuspackage/prometheus /usr/local/bin/
sudo cp prometheuspackage/promtool /usr/local/bin/

sudo chown prometheus:prometheus /usr/local/bin/prometheus
sudo chown prometheus:prometheus /usr/local/bin/promtool

sudo cp -r prometheuspackage/consoles /etc/prometheus
sudo cp -r prometheuspackage/console_libraries /etc/prometheus

sudo chown -R prometheus:prometheus /etc/prometheus/consoles
sudo chown -R prometheus:prometheus /etc/prometheus/console_libraries/
h) Create the configuration file
sudo nano /etc/prometheus/prometheus.ymlThe configuration file can look like this
global:
  scrape_interval: 15s

scrape_configs:
  - job_name: 'atavism'
    # Override the global default and scrape targets from this job every 5 seconds.
    scrape_interval: 30s
    static_configs:
      - targets: ['localhost:8200', 'localhost:8201', 'localhost:8202', 'localhost:8203', 'localhost:8204', 'localhost:8205', 'localhost:8206', 'localhost:8207', 'localhost:8208', 'localhost:8209', 'localhost:8210', 'localhost:8211', 'localhost:8212', 'localhost:8213', 'localhost:8214', 'localhost:8215', 'localhost:8216']
    relabel_configs:
      - source_labels: [__address__]
        regex: '(.+):.*'
        target_label: instance
        replacement: ${1}

remote_write:
  # Replace with your Prometheus Grafana (Remove Write Endpoint)
  - url: https://prometheus-prod-10-prod-us-central-0.grafana.net/api/prom/push
    basic_auth:
      # Replace with your Prometheus Grafana (Username / Instance ID)
      username: 492378
      # Replace with your Prometheus Grafana (API Key)
      password: eyJrIjoiODIzYjk2MmFmZWE5YWQ4YzY3NmE1ZjZkOTkzMWZmNDJjZjM3YWNjMiIsIm4iOiJhdGF2aXNtdGVzdGFwaSIsImlkIjo2NzUzMDB9
Important Note: Replace ULR, Username, and API Key/Password with values taken from Grafana and saved in the text document in steps 1.f) and 1.h)
i) Create Prometheus Service
sudo nano /etc/systemd/system/prometheus.servicewhich should look like this
[Unit]
Description=Prometheus
Wants=network-online.target
After=network-online.target

[Service]
User=prometheus
Group=prometheus
Type=simple
ExecStart=/usr/local/bin/prometheus \
    --config.file /etc/prometheus/prometheus.yml \
    --storage.tsdb.path /var/lib/prometheus/ \
    --web.console.templates=/etc/prometheus/consoles \
    --web.console.libraries=/etc/prometheus/console_libraries

[Install]
WantedBy=multi-user.target
j) Reload system daemon
sudo systemctl daemon-reloadk) Now you can start, stop, or check the status of the service using these commands
sudo systemctl start prometheus

sudo systemctl stop prometheus

sudo systemctl status prometheus
l) Optionally you can also add this service to auto start
sudo systemctl enable prometheus - Grafana Dashboard Configuration
a) On the grafana.com website click Launch in the Grafana Box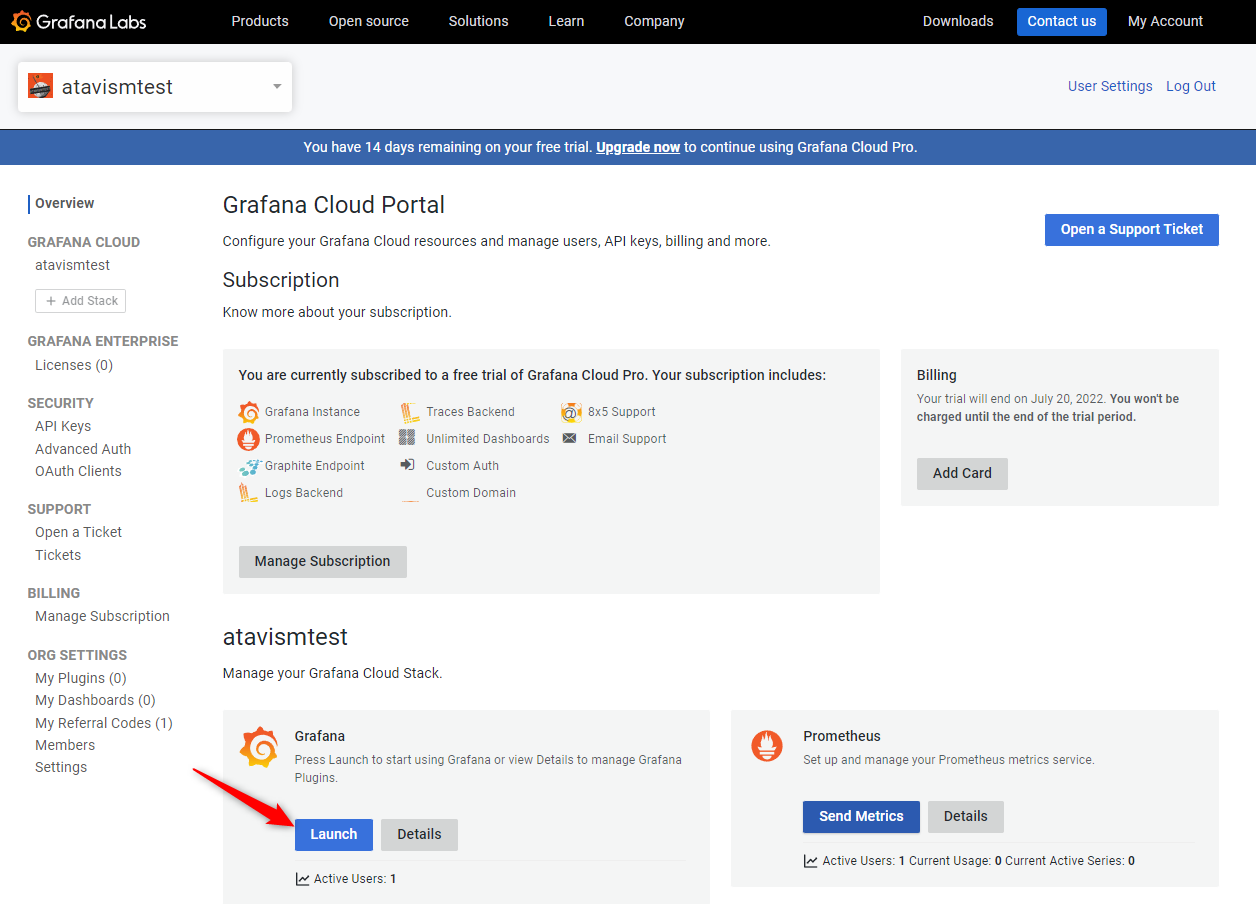
b) Click the Dashboards icon and select Import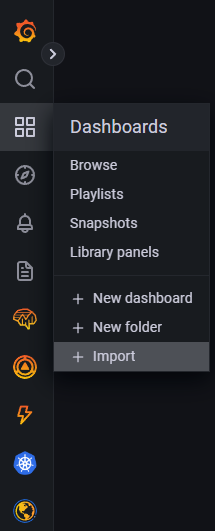
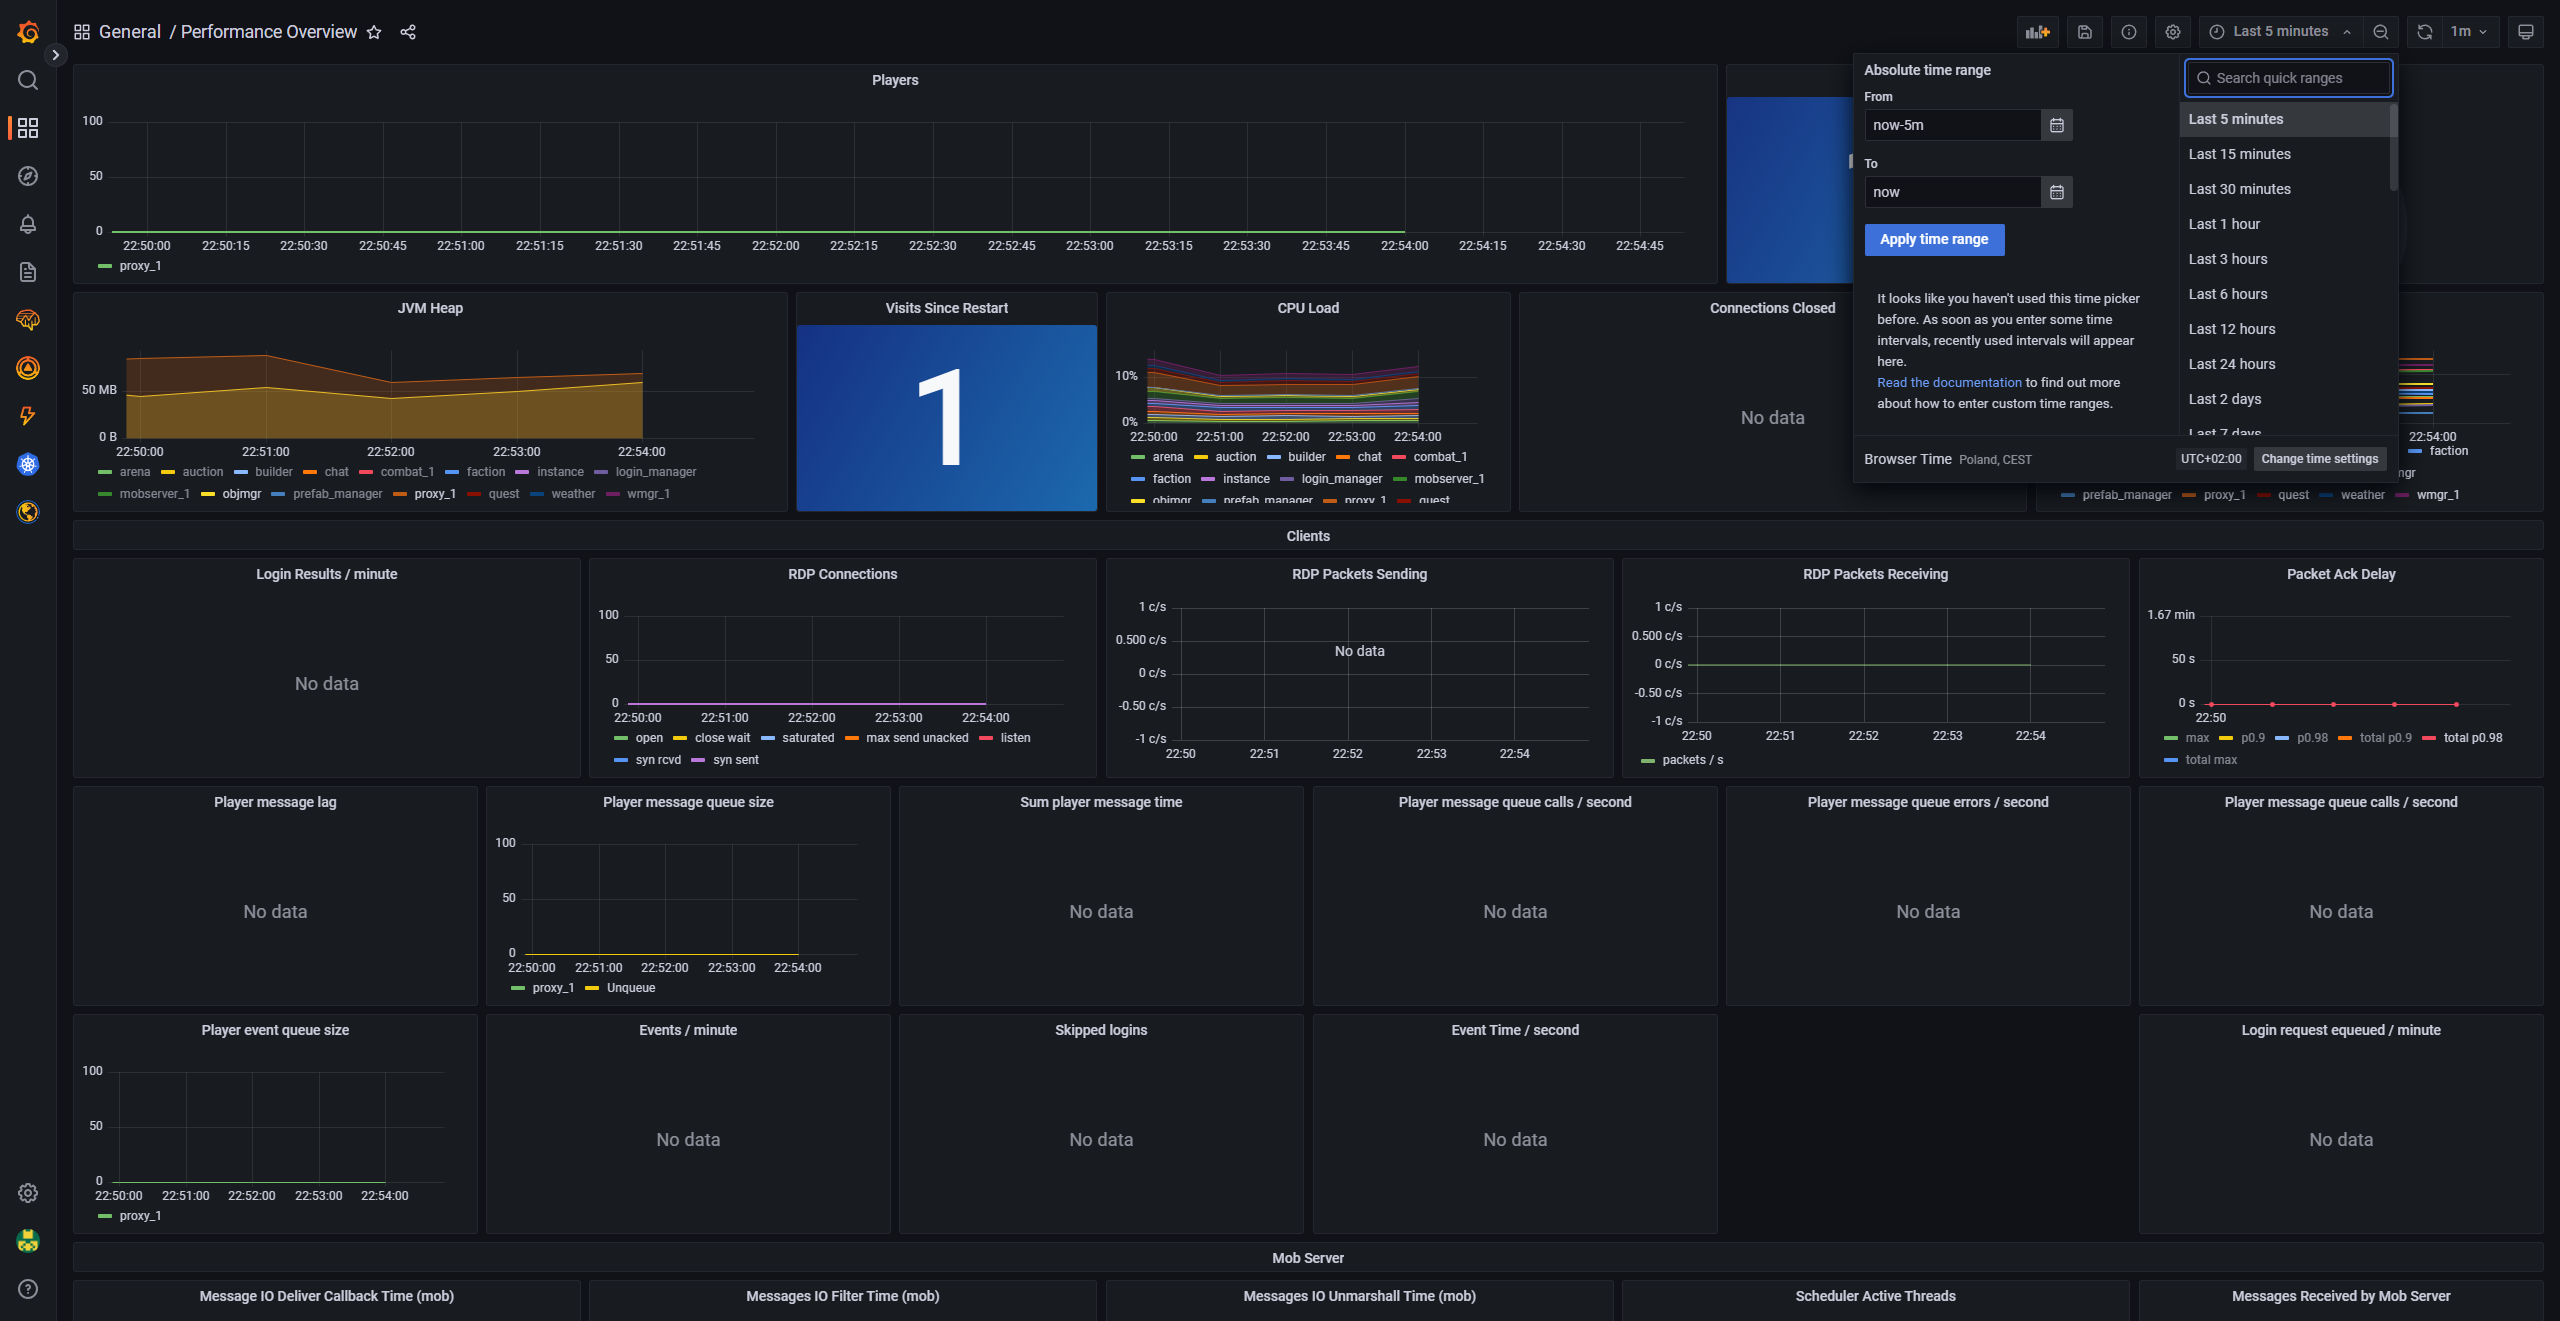
c) Download the example dashboard for Ataivsm from here and use it in the Import form opened in step 3. b) along with Name that by default we set as Performance Overview and can be changed. You can also leave the Folder as the default one which should be General and click Import.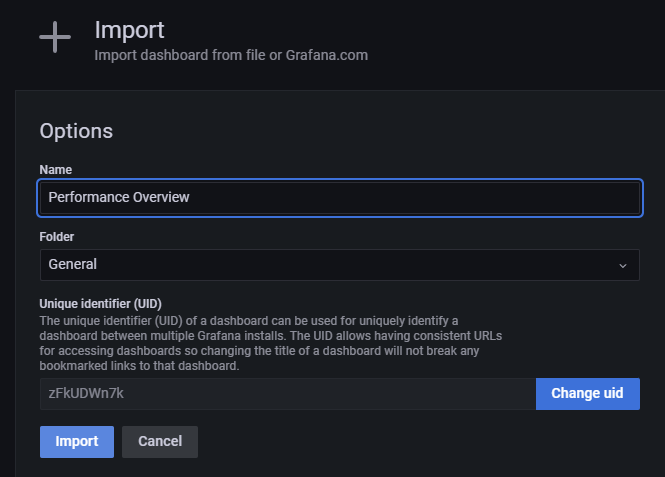 You should be redirected to the imported dashboard which should look like this
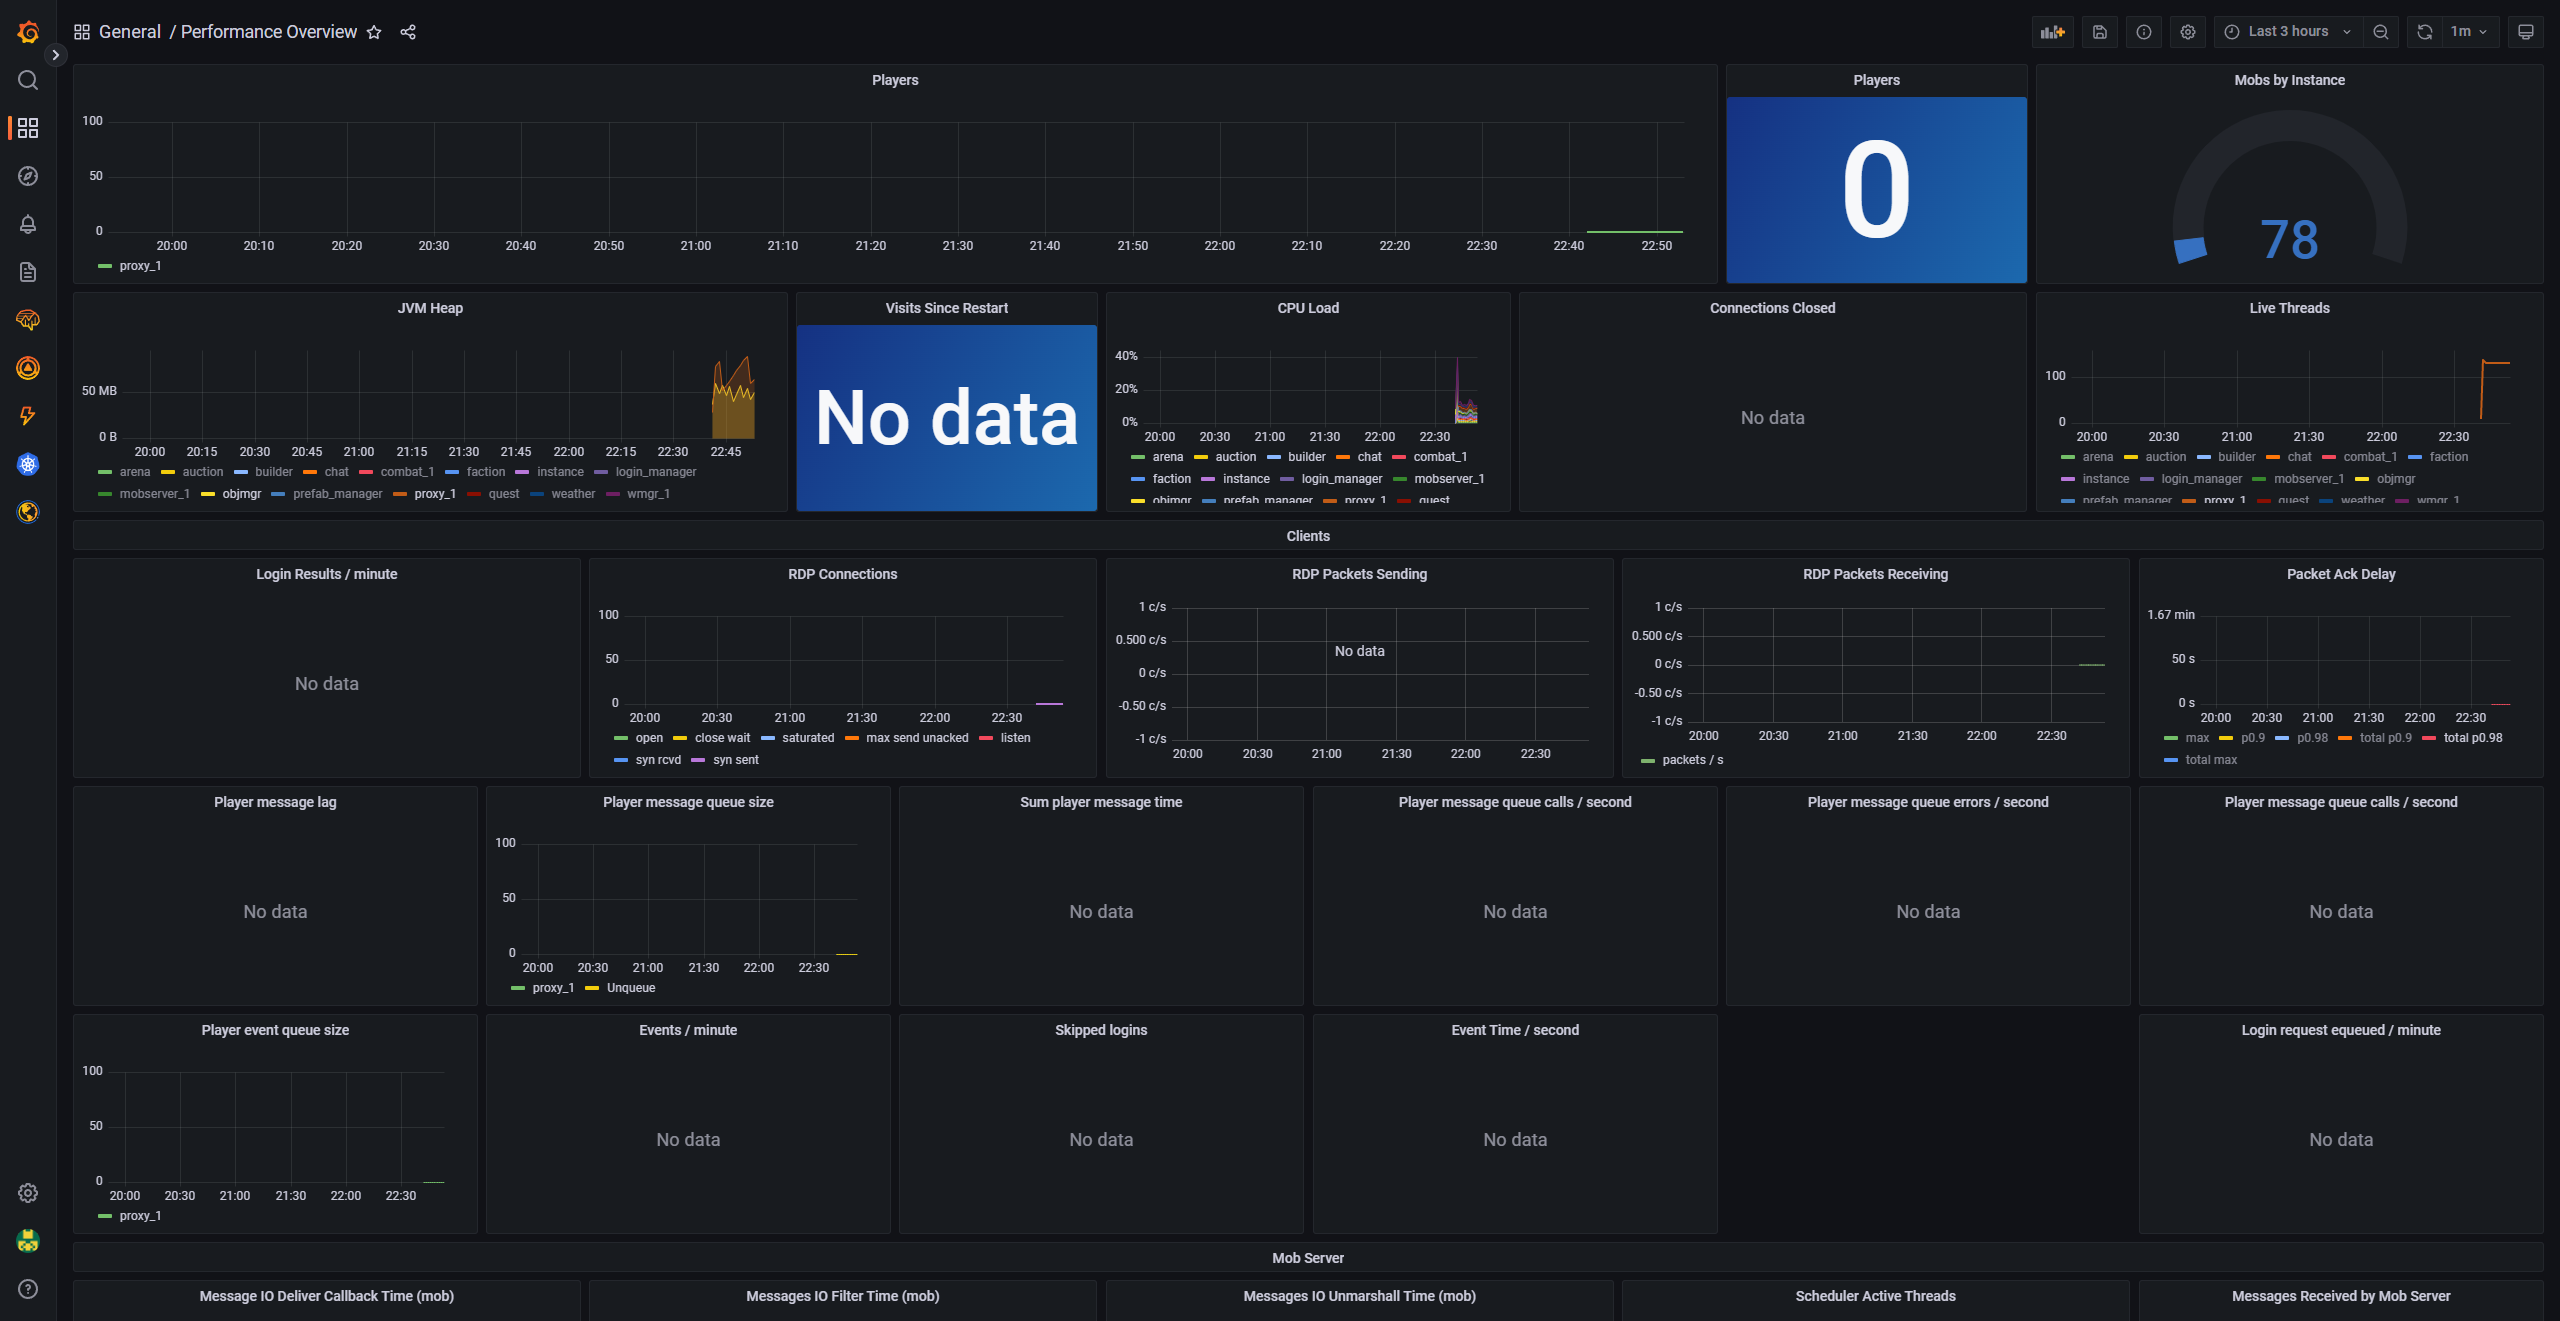
and when you will start the Atavism Server the data should start to flow and you should see more data like the number of logged players and server usage
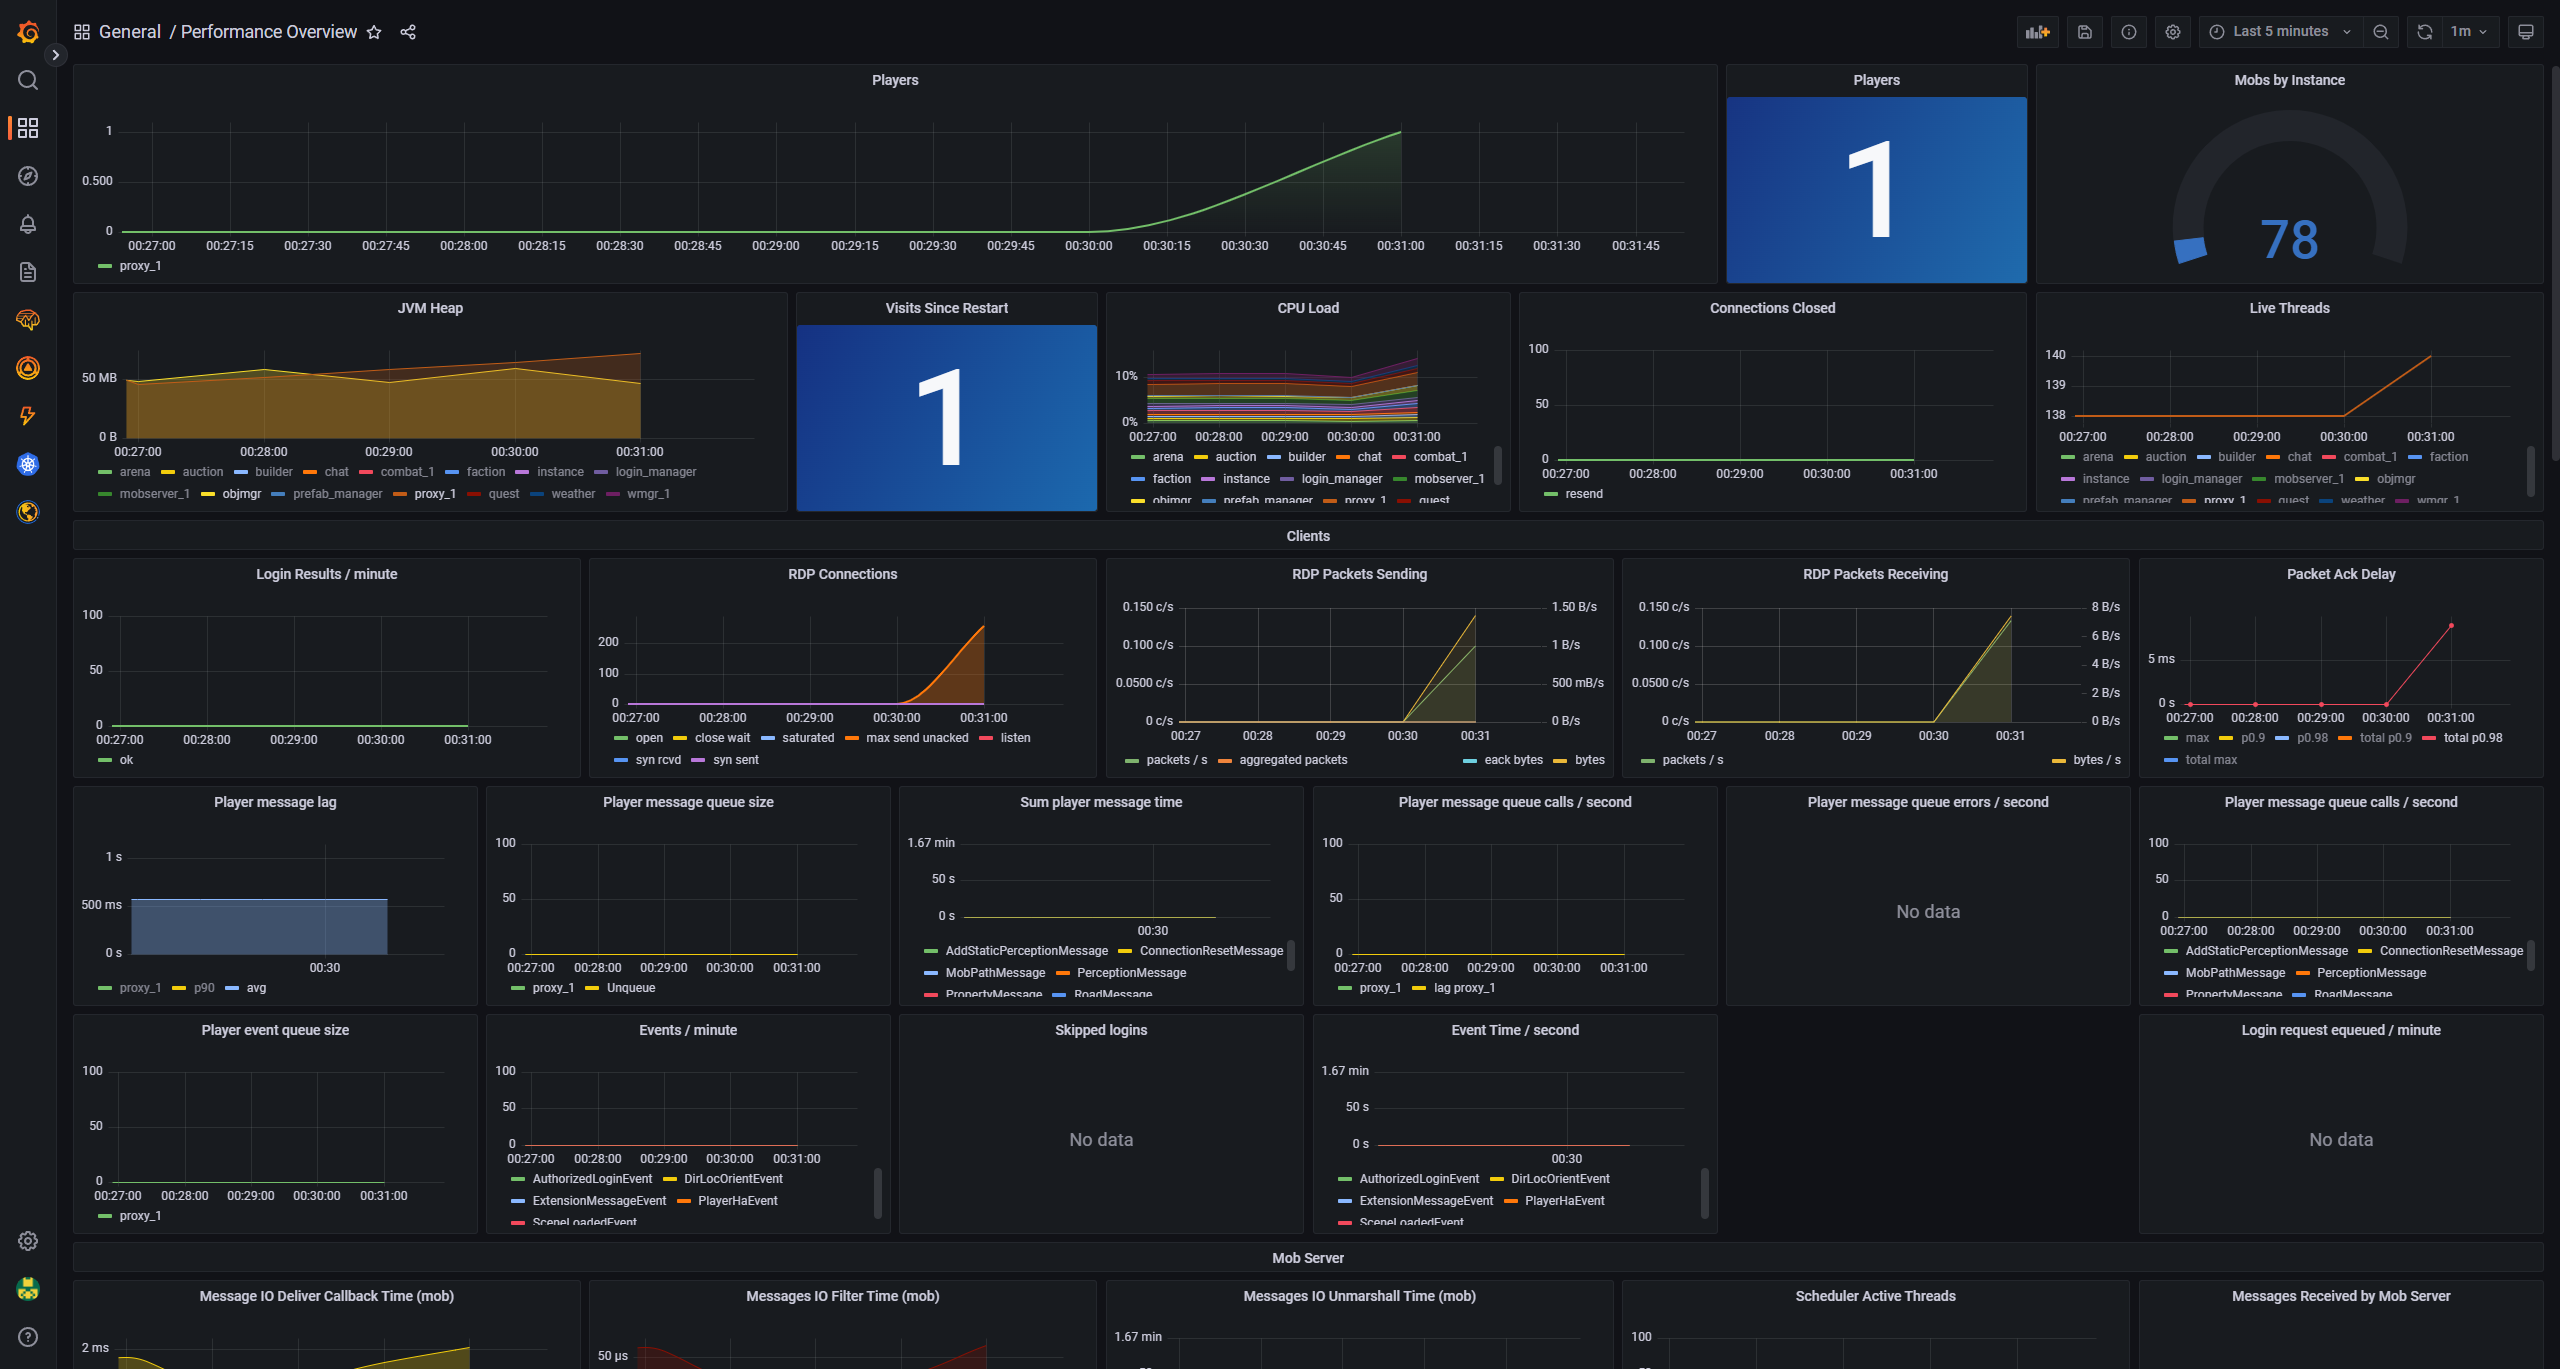
You can also switch between sample timeframe to see more details